

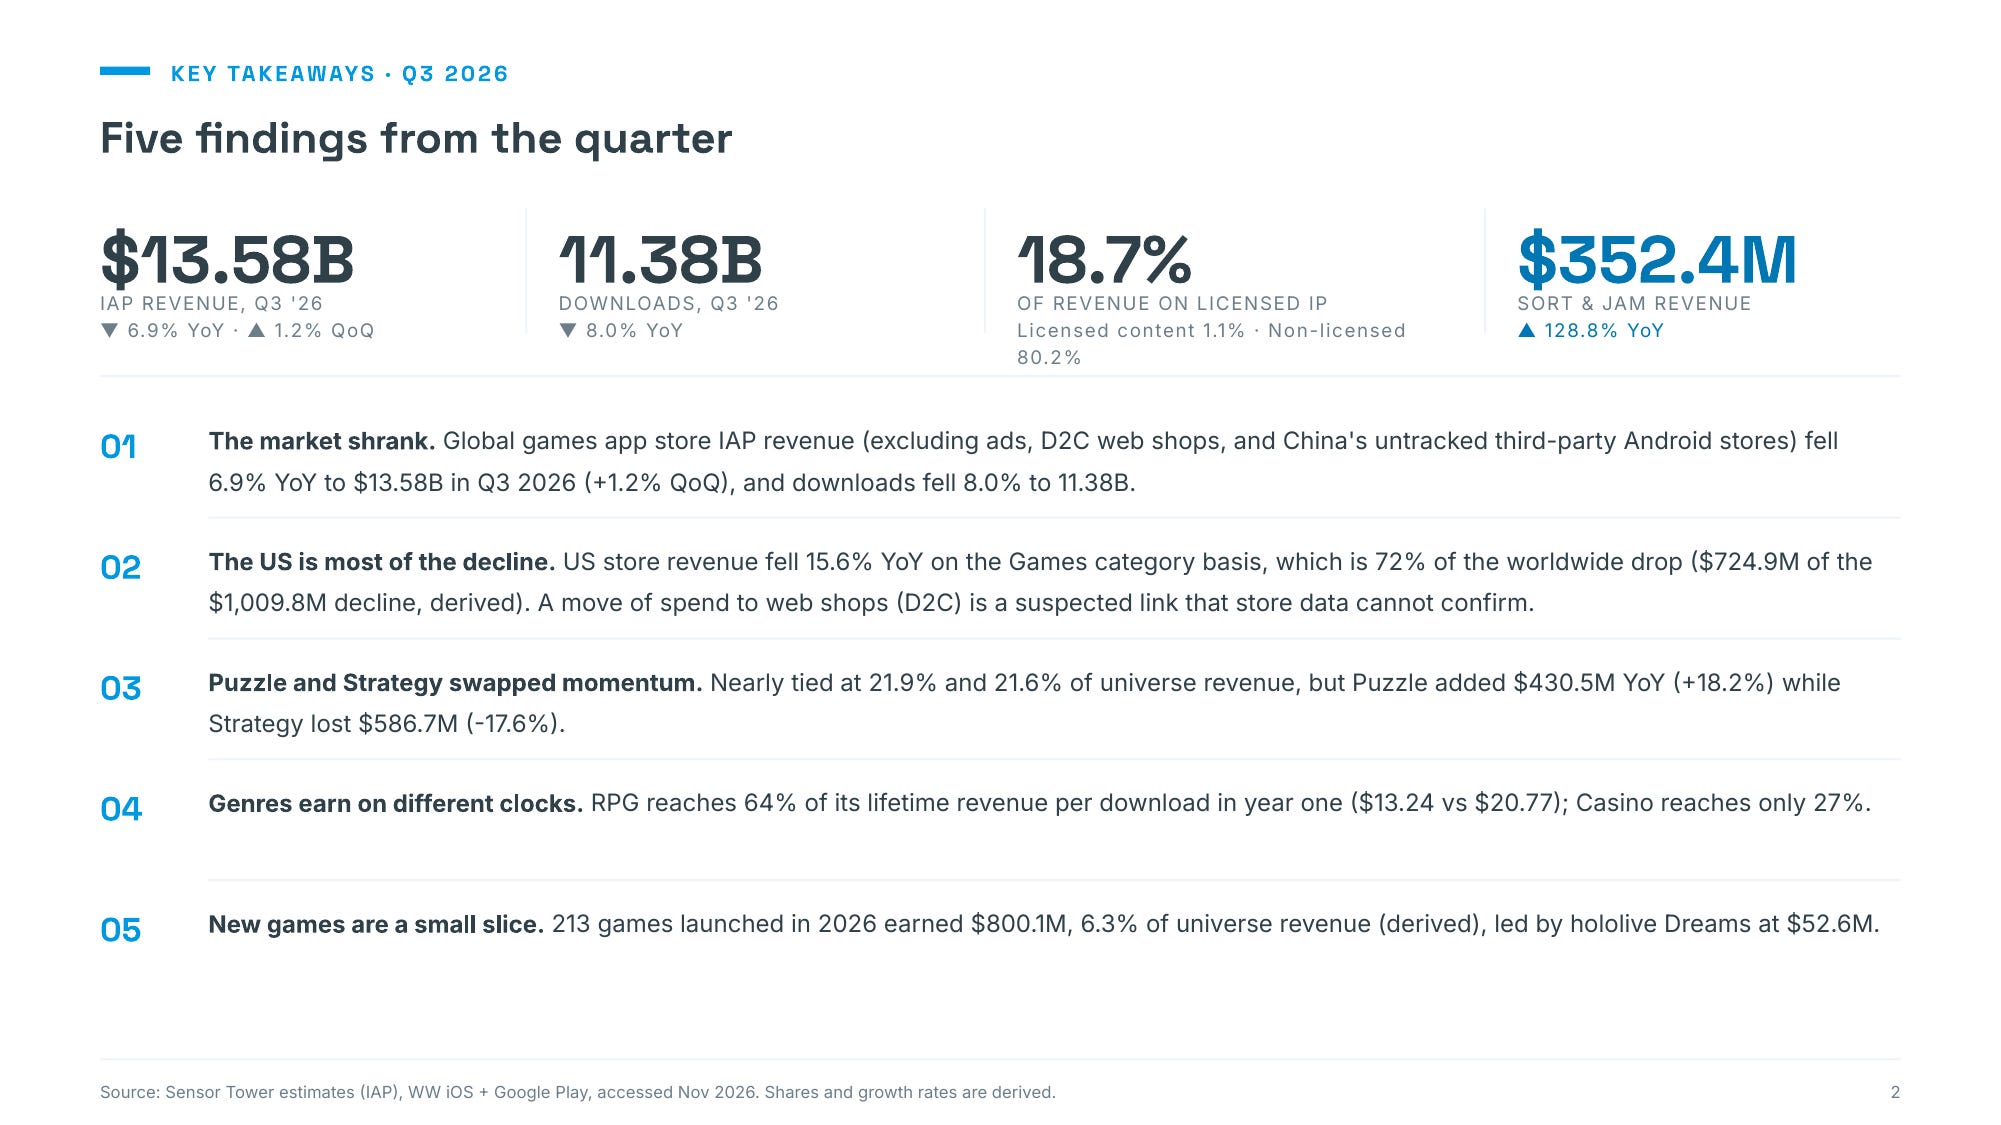
Mobile games IAP revenue fell 6.9% last quarter. One country drove 72% of that decline.
The big question: did that country’s players spend less, or did revenue move where app stores can’t see it?
I spent the last month rebuilding a report I first helped make ten years ago when I co-published the mobile trends report with Sensor Tower at SEGA. The 2026 edition covers 1,556 games (each earned over $250K in at least one month of the quarter) labeled by genre, subgenre, and licensing.
Those 1,556 games are the "universe" behind every number in this post. This isn't all mobile game revenue: it excludes ads, direct-to-consumer web shops, China's third-party Android stores, and the long tail of games below the $250K bar.
And it has a twist none of us saw coming back then: the data itself is tracking less.
Here are the five takeaways I’d want any studio leader to know.
1. The US is most of the decline, and it might be an illusion
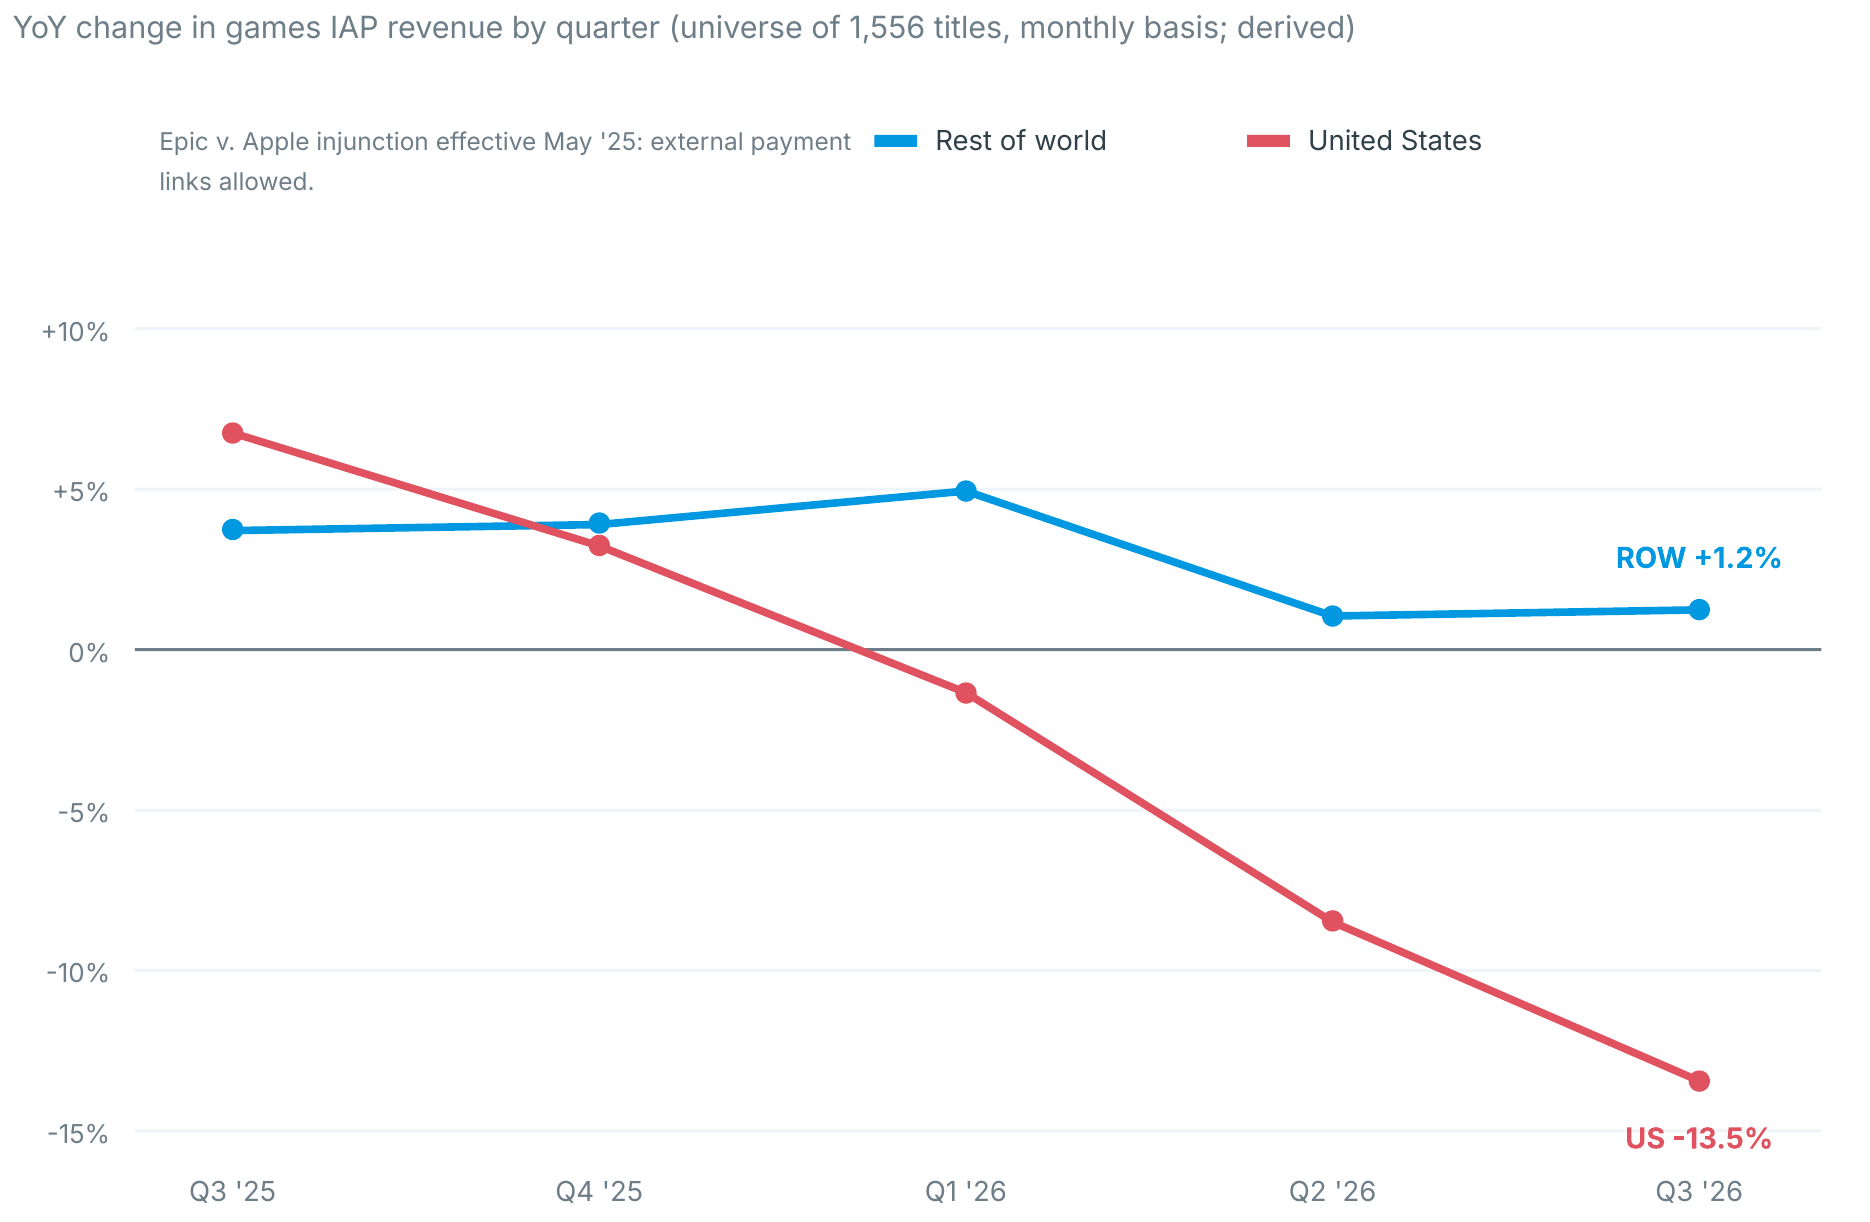
US store revenue fell 13.5% YoY, which is 72% of the worldwide drop. The US was the only key market down double digits. Korea grew 14.1% QoQ.
The split is iOS-led. In the US, iOS fell 20.4% YoY, while Google Play fell 6.7%. Midcore took the hit: US midcore fell 26.5% while US casual grew 5.6%.
My read: a shift of spending to publisher web shops (D2C) is the suspected link, but store data cannot confirm it. Playtika’s disclosed D2C share rose from 25.3% in Q2 2025 to 39.3% in Q2 2026. Sensor Tower measures app store IAP only, so a store decline is not the same as a drop in what US players spend.
So what: the next time a competitor's US revenue falls off a cliff in Sensor Tower, don't write their obituary; check whether they shipped a web shop first. Store data now measures a channel, not a business. That also cuts the other way: a title "holding share" in a shrinking store market may just be slower at D2C than its peers.
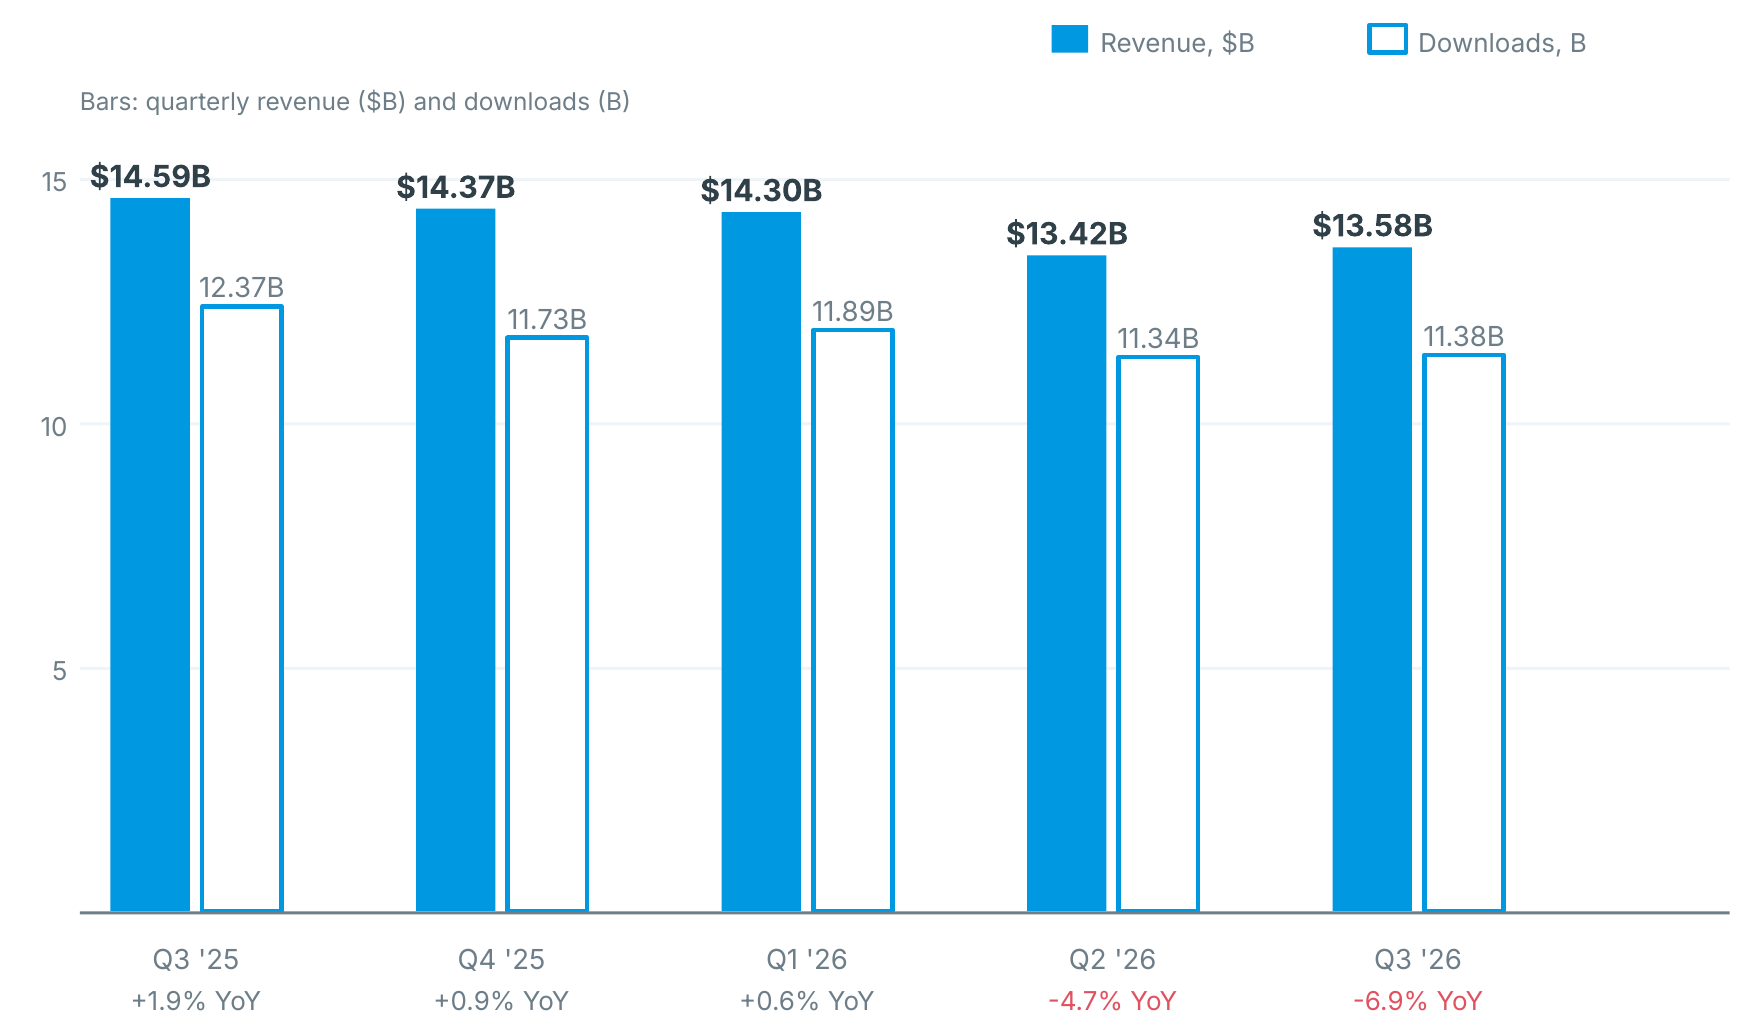
Global context: worldwide games IAP revenue fell 6.9% YoY to $13.58B in Q3 2026, and downloads fell 8.0% to 11.38B. Downloads falling harder than revenue points to a real engagement loss underneath any D2C shift: not all of the decline is money moving off-store. iOS also carried 62.0% of Q3 revenue, down from 63.3% a year earlier.
The full 56-slide report, with every subgenre drill-down, the 64-subgenre concentration map, country profiles, and the full methodology, is $100:: Get the full report
2. Is Puzzle really the only open genre?
At GDC earlier this year, Gabe Leydon, the Machine Zone founder who built Game of War into a 4X empire, told me over midnight Super Duper milkshakes: “The only open genre in games is the puzzle market.”
This quarter’s data says he’s mostly right. With one big asterisk.
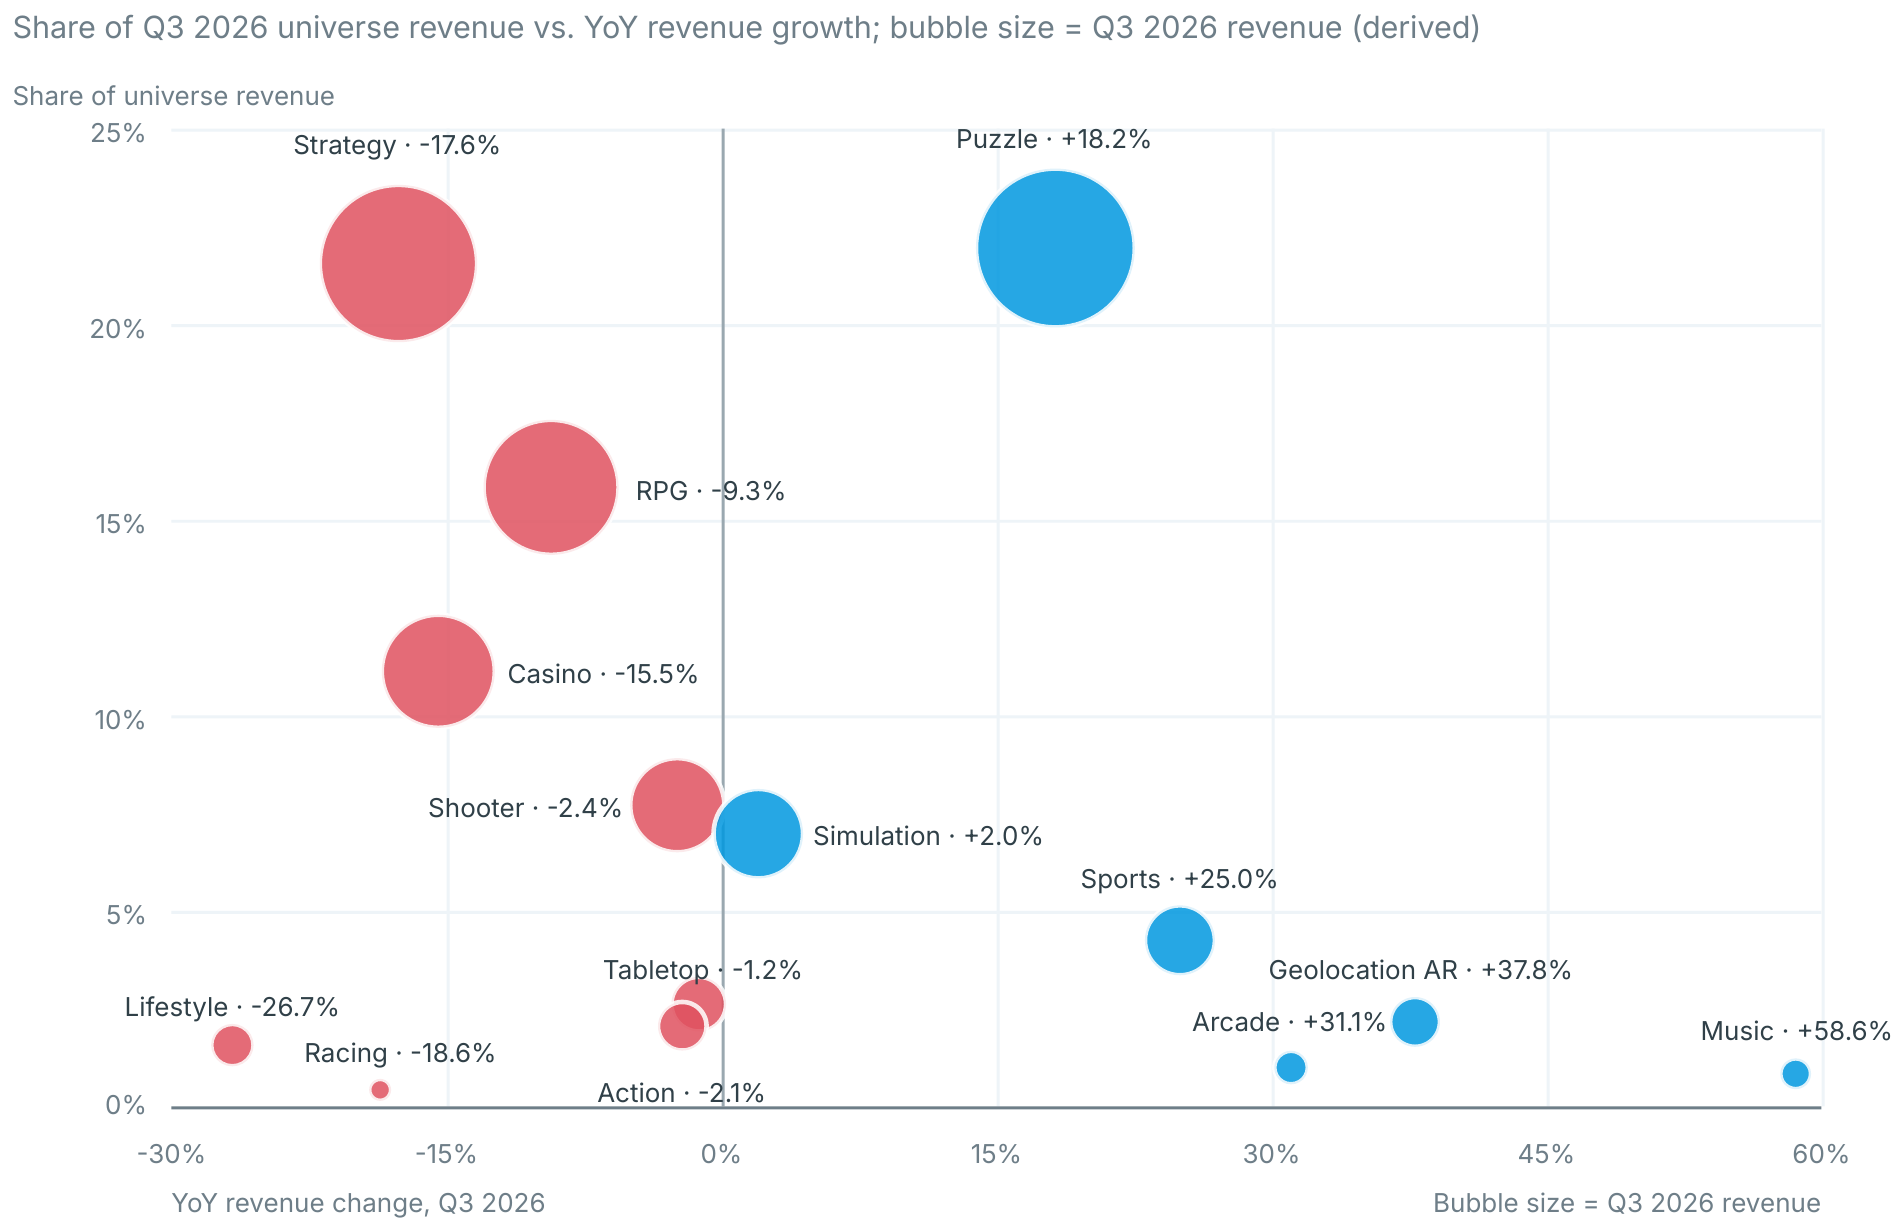
The two biggest genres are nearly tied at 21.9% and 21.6% of universe revenue, but they’re moving in opposite directions. Puzzle added $430.5M YoY (+18.2%), more than the next four gaining genres combined. Strategy, Leydon’s old kingdom, lost $586.7M (-17.6%), led by Last War: Survival and Whiteout Survival. Puzzle was the only top genre to grow significantly.
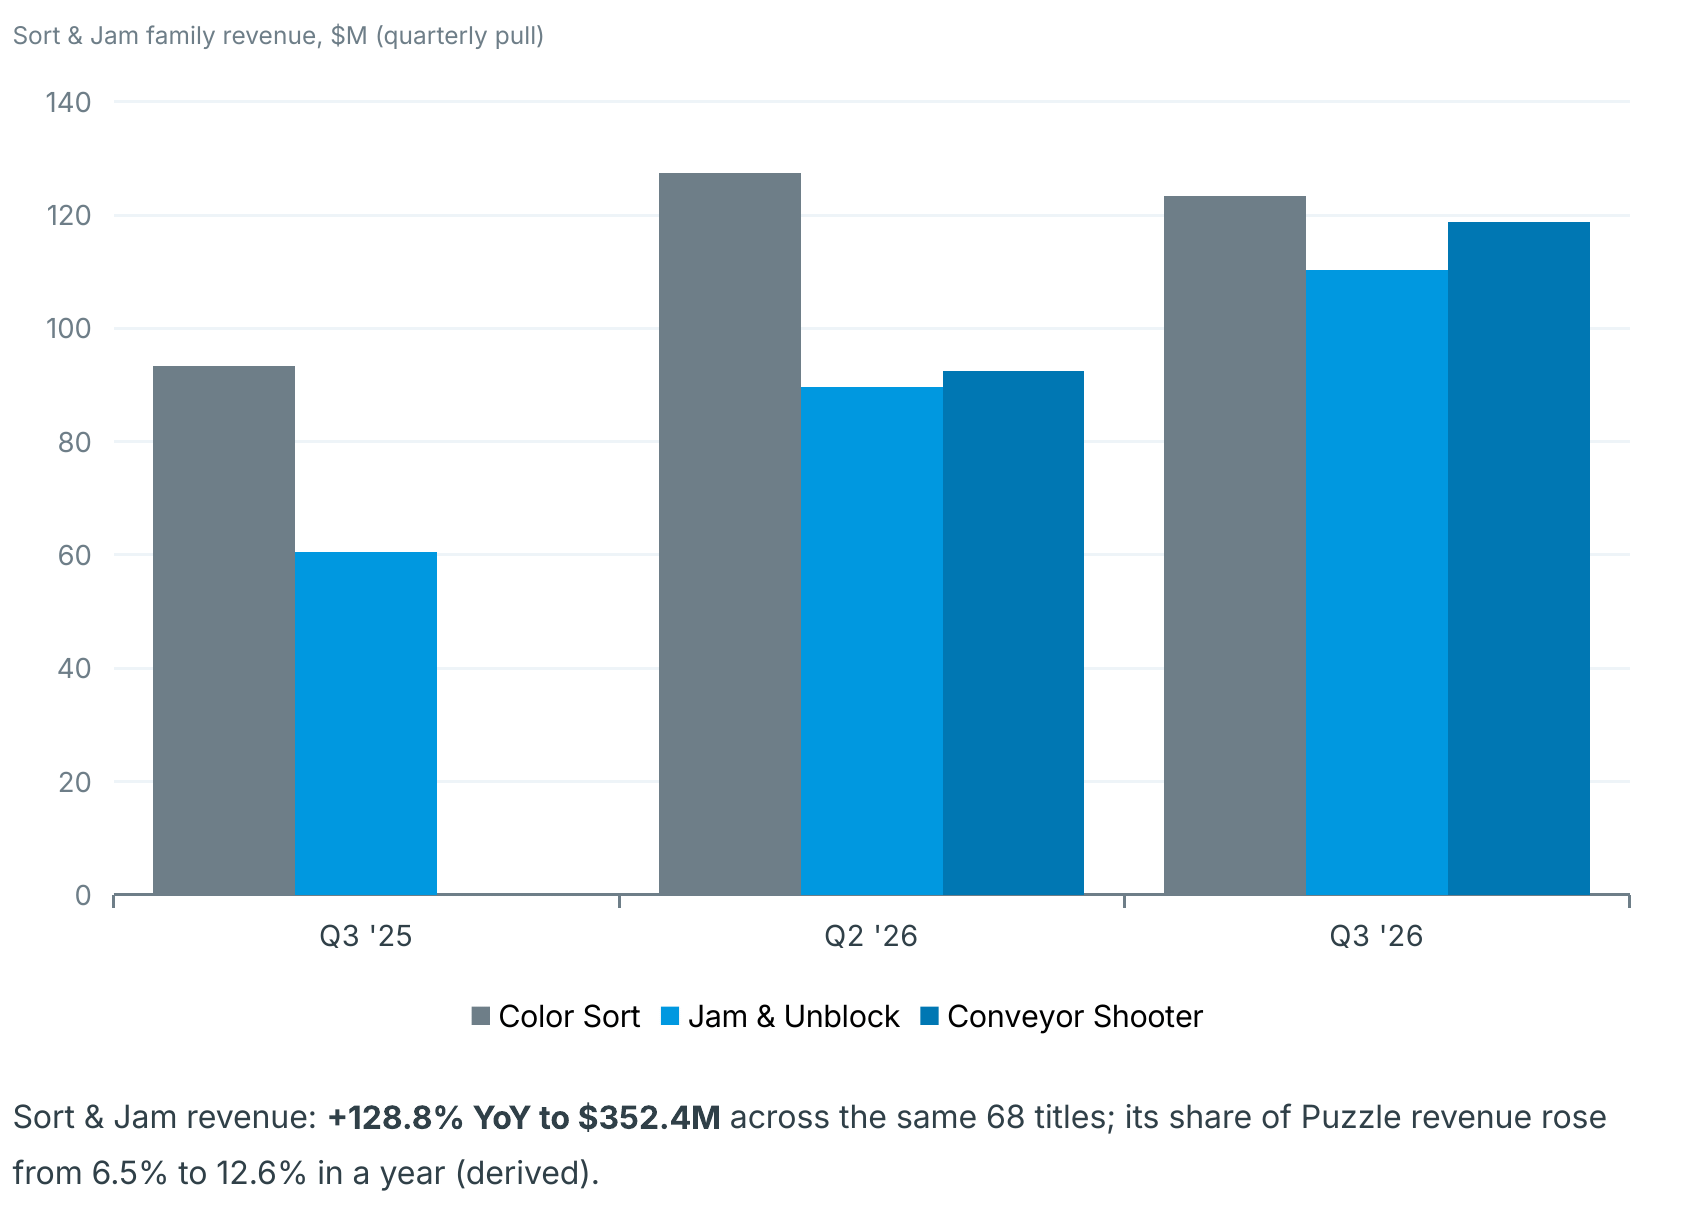
More telling: Puzzle is where new subgenres get invented and rewarded. Merge passed Classic Match 3 as the top subgenre, now at 29.0% of Puzzle revenue (+69.2% YoY), with Gossip Harbor at 38.4%. Sort & Jam grew 128.8%.
Candy Crush and Royal Match looked unassailable. None of the new winners had to beat them. They invented subgenres the incumbents don't compete in.
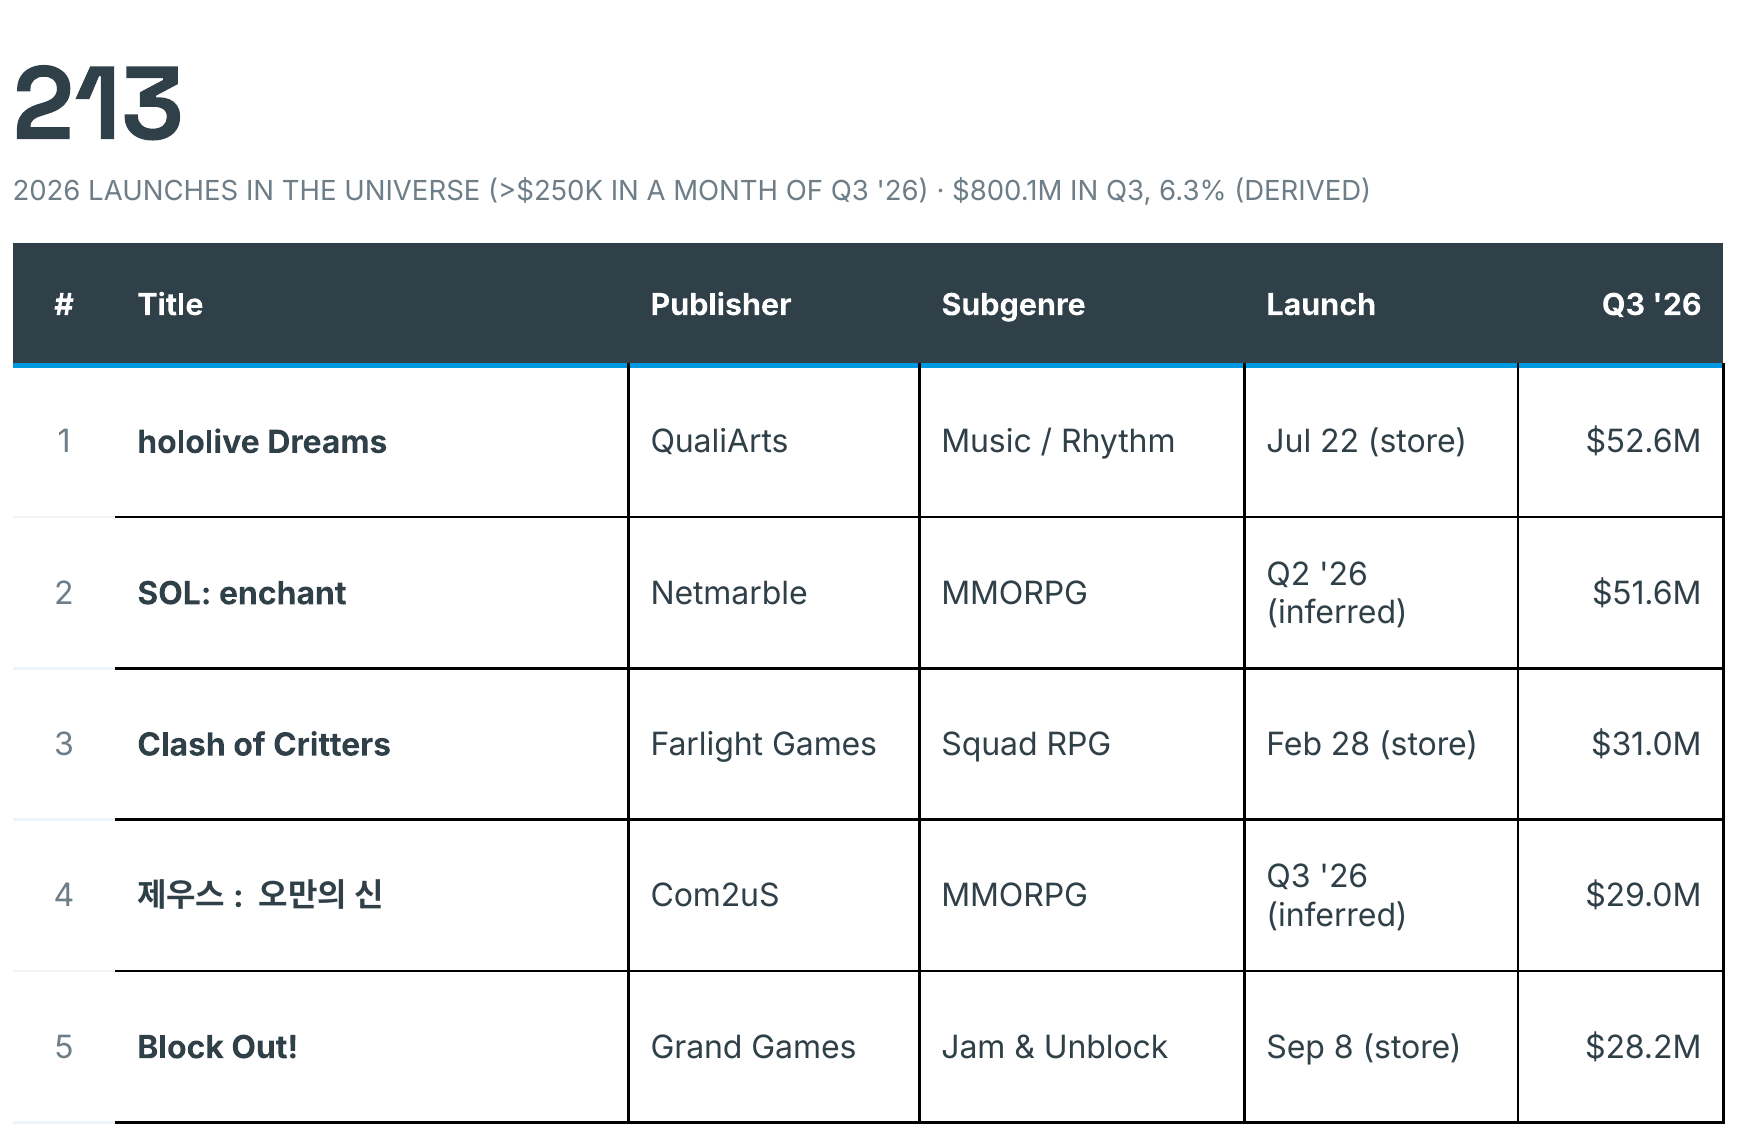
The asterisk: open doesn’t mean lucrative in IAP. The new puzzle wave monetizes through ads ($1.46 per download vs $4.68 for Puzzle overall), and the winnings concentrate fast; one title already owns 38% of Merge. And there’s a second door nobody mentions: six of the top 10 2026 launches are RPGs, paying 4.7x more per download than Puzzle. Puzzle is the open-volume game; Asia-first RPG is the open-value game.
So what: greenlighting a 4X in 2027? This chart is your warning. Merge, Idle RPG, and Tower Defense are the open lanes: growing, proven by 2026 launches, and no locked podium at the top. But if you enter Puzzle’s new lanes, plan for an ads-first model and a window measured in quarters, not years.
3. The Sort & Jam wave is real revenue
Sort & Jam revenue grew 128.8% YoY to $352.4M across the same 68 titles. Its share of Puzzle revenue rose from 6.5% to 12.6% in a year.
It’s still a downloads-first business: 12.6% of Puzzle revenue but 40.4% of its downloads, earning $1.46 per download against $4.68 for Puzzle overall. Conveyor Shooter didn’t exist a year ago and earned $118.8M in Q3 2026, led by Pixel Flow. Keep in mind this is IAP only. For these games, ads carry much of the model, and that revenue isn’t counted here.
So what: don’t benchmark Sort & Jam games against Puzzle on IAP per download; their model is ads, so the comparison misprices them. When you screen the genre for comps or acquisition targets, expect the IAP line to understate a healthy business.
4. New games are a small slice
213 games launched in 2026 earned $800.1M in Q3, 6.3% of universe revenue. Incumbents kept 93.7%. The best performer, hololive Dreams, reached #40 worldwide at $52.6M. No 2026 launch cracked the top 25.
The breakouts mostly aren’t American. Four of the top 10 launches earned no US revenue in Q3.
So what: if you’re launching in 2026, plan your year-one revenue targets and UA payback against a ~#40 worldwide ceiling. The new-game window opens for RPGs and Asia-first launches, not casual Western titles.
5. About a dollar in five rides on someone else’s IP
Licensed IP is 18.7% of universe revenue, and it doesn’t monetize worse for borrowing its brand. Licensed games earned $6.42 per download in Q3 against $4.69 for non-licensed games.
The biggest owner categories: video game franchises (35.3% of licensed revenue, led by Pokémon GO), sports leagues and players (19.0%, led by eFootball, +29.7% YoY), and anime and manga (16.0%, led by Fate/Grand Order). The top 10 licensed titles hold 54.7% of the label’s revenue.
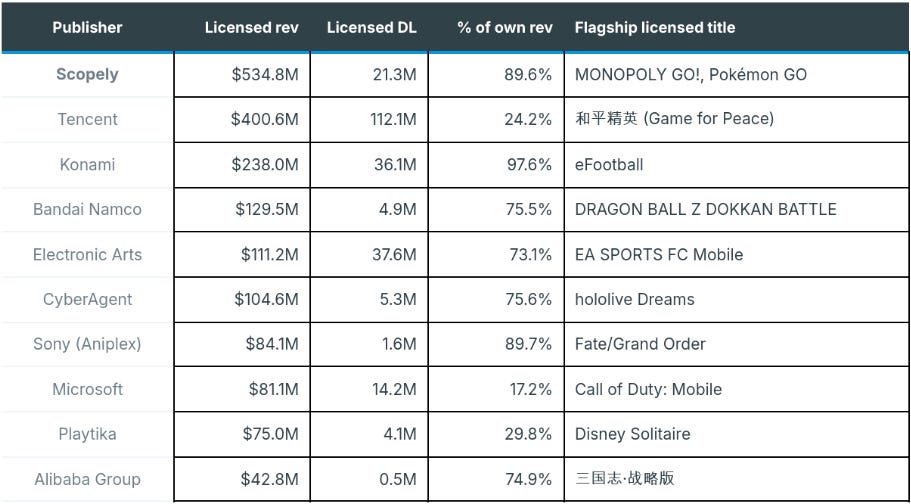
So what: licensing is a real strategy, not a tax. It’s the fastest payback clock of the three label types. But check which side of the table you’d sit on: Konami’s revenue is 98% licensed; Tencent’s only 24%.
Want to explore the data yourself?
I also built a more comprehensive interactive edition of this report: a browsable version of the key findings covering the market, movers and shakers, genres, regions, and licensed IP. It’s a perk for paid Gamemakers subscribers.
Get the full report
This post covers five findings, the interactive report a bit more, and the full Q3 2026 report has the rest: every genre and subgenre deep-dive, the US, China, Japan, and Korea market profiles, publisher and title rankings, licensed IP economics, open lanes vs closed doors, and the full methodology.
If you’re planning a 2027 roadmap, planning a new game, or considering company strategy, it’s $100 (secure checkout through Polar):
All figures are Sensor Tower estimates (net IAP revenue; iOS + Google Play worldwide, China iOS only). They exclude ads, D2C web shops, and third-party Android stores.